
- Address
- 400 Fisher Rd, Brevard, NC 28712
Open in Maps → - Phone
- (828) 884-2091
- Grades served
- 6-8
- NCES school ID
- 370453001779
School calendar
Brevard Middle's own events for the year — school events, holidays, breaks and teacher workdays — with a printable PDF and a calendar file you can subscribe to.
View the calendar →Location and nearby schools
10 nearestLoading the map…
- Brevard Elementary1.5 mi
- Pisgah Forest Elementary1.6 mi
- Davidson River School1.6 mi
- Brevard High2.0 mi
- Brevard Academy2.9 mi
- Rosman High8.8 mi
- Rosman Middle8.8 mi
- Rosman Elementary9.0 mi
- Etowah Elementary9.3 mi
- T C Henderson12.1 mi
How Brevard Middle compares
Its 2024–25 performance score of 54 against comparable schools. Percentile is the share of that group scoring lower.
Chronic absence is lower here than at 42% of the 2,482 North Carolina schools reporting it.
Performance score since 2014
Score down 11 points since 2014 (65 → 54). Met or exceeded expected growth in 7 of 10 years, exceeding it in 3. No grades were issued for 2020 or 2021.
| Year | Score | Grade | Growth | Achievement |
|---|---|---|---|---|
| 2025 | 54 | D | Not Met | 54 |
| 2024 | 64 | C | Met | 58.9 |
| 2023 | 68 | C | Exceeded | 61.6 |
| 2022 | 59 | C | Met | 53.7 |
| 2019 | 73 | B | Exceeded | 70 |
| 2018 | 65 | C | Not Met | 64.8 |
| 2017 | 65 | C | Met | 64 |
| 2016 | 68 | C | Not Met | 68 |
| 2015 | 68 | C | Met | 65 |
| 2014 | 65 | C | Exceeded | 60 |
Rankings and trends are calculated by Back To School NC from NC DPI report card results; NC DPI publishes each school's own figures but not its standing among peers. See Transylvania County Schools for district totals.
Student Demographics
Gender Distribution
Total Students: 472Student counts for Brevard Middle, 2024-2025, from the NCES Common Core of Data. Percentages are of 472 students and may not total 100% because of rounding.
Students
Student Population
Students Counted: 493Student indicators for Brevard Middle, 2024-2025, from the North Carolina School Report Cards. Attendance is out of the 493 students DPI counted. A student is chronically absent after missing 10% or more of the days enrolled; the other measures overlap it and each other.
Teachers
Licensing & Certification
Total Teachers: 36.9 FTETeacher figures for Brevard Middle, 2024-2025, from the North Carolina School Report Cards. Counts are full-time equivalents, not headcount. Licensing and certification percentages are each out of 36.9 FTE.
NC School Report Card
2024-2025Student performance by subject
| Subject | Grade-level proficient | Career & college ready |
|---|---|---|
| Science (grades 5 & 8) | 62.8% | 46.6% |
| Reading (grades 3–8) | 53.1% | 31.4% |
| Mathematics (grades 3–8) | 51.9% | 33.3% |
Grade-level proficient is levels 3–5; career and college ready is the higher bar of levels 4–5.
Achievement levels
| Subject | Not Proficient | Level 3 | Level 4 | Level 5 |
|---|---|---|---|---|
| Mathematics (grades 3–8) | 48.1% | 18.5% | 23.5% | 9.8% |
| Reading (grades 3–8) | 46.9% | 21.6% | 20.3% | 11.1% |
| Science (grades 5 & 8) | 37.2% | 16.2% | 38.5% | 8.1% |
Academic growth
| Measure | Status | Growth index | Score |
|---|---|---|---|
| Overall | Does Not Meet Expected Growth | -7.71 | 53.8 |
Teachers
Reported as full-time-equivalent staff, so figures carry decimals.
| Measure | Value |
|---|---|
| Total teachers | 36.87 |
| Experienced teachers | 33.17 (90%) |
| Beginning teachers | 3.7 (10%) |
| Holding a standard license | 34.07 (92%) |
| Emergency or provisional licenses | 2.8 (8%) |
| National Board certified | 4 |
Students
| Measure | Value |
|---|---|
| Chronically absent (120 of 493) | 24.3% |
| Economically disadvantaged | 45% |
| English learners making progress (of 41) | 7.3% |
School environment
| Measure | Value |
|---|---|
| Devices per student | 0.82 |
| Library books per student | 35.79 |
| Students have device access | Yes |
| Devices may go home | Yes |
| Wireless access points per classroom | 1.23 |
Federal & state designations
| Designation | Applies |
|---|---|
| Low-performing school | Yes |
| Recurring low-performing | No |
| CSI — low performing | No |
| CSI — low graduation rate | No |
| TSI — at risk | Yes |
| TSI — consistently underperforming | No |
CSI is Comprehensive Support and Improvement; TSI is Targeted Support and Improvement, both federal ESSA categories.
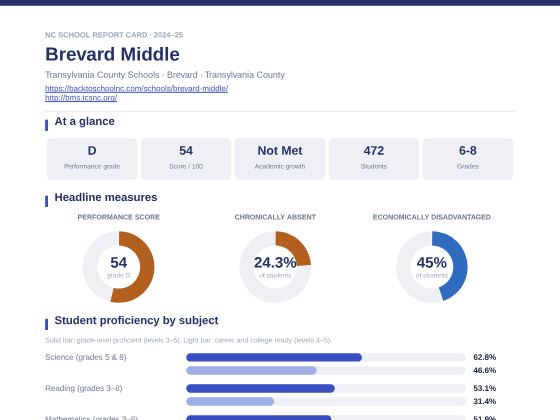
Download this report card
Brevard Middle's 2024-2025 report card as an interactive PDF — bookmarked sections, donut and bar charts for performance, attendance and achievement levels, and the NC DPI and NCES sources cited with working links.
Other middle schools in this district
All 9 schools →Enrollment and staffing come from the NCES Common Core of Data (CCD), U.S. Department of Education for 2024-2025; performance, attendance and economic-need figures are the state's NC School Report Card for the same year. Contact the school to confirm current details.